Designing Data Products#
Why would we build a model?#
Exploratory analysis - understand what happened in the past
Predictive analyis - predict what will happen
Predict what, for whom and for what purpose?
Product = Customer x Business x Technology#
Usability
Business viability
Feasibility
Value = product of the three (If one is zero then the value is zero too.)
Measuring success#
The first model you build should be the simplest model that could address the product needs.
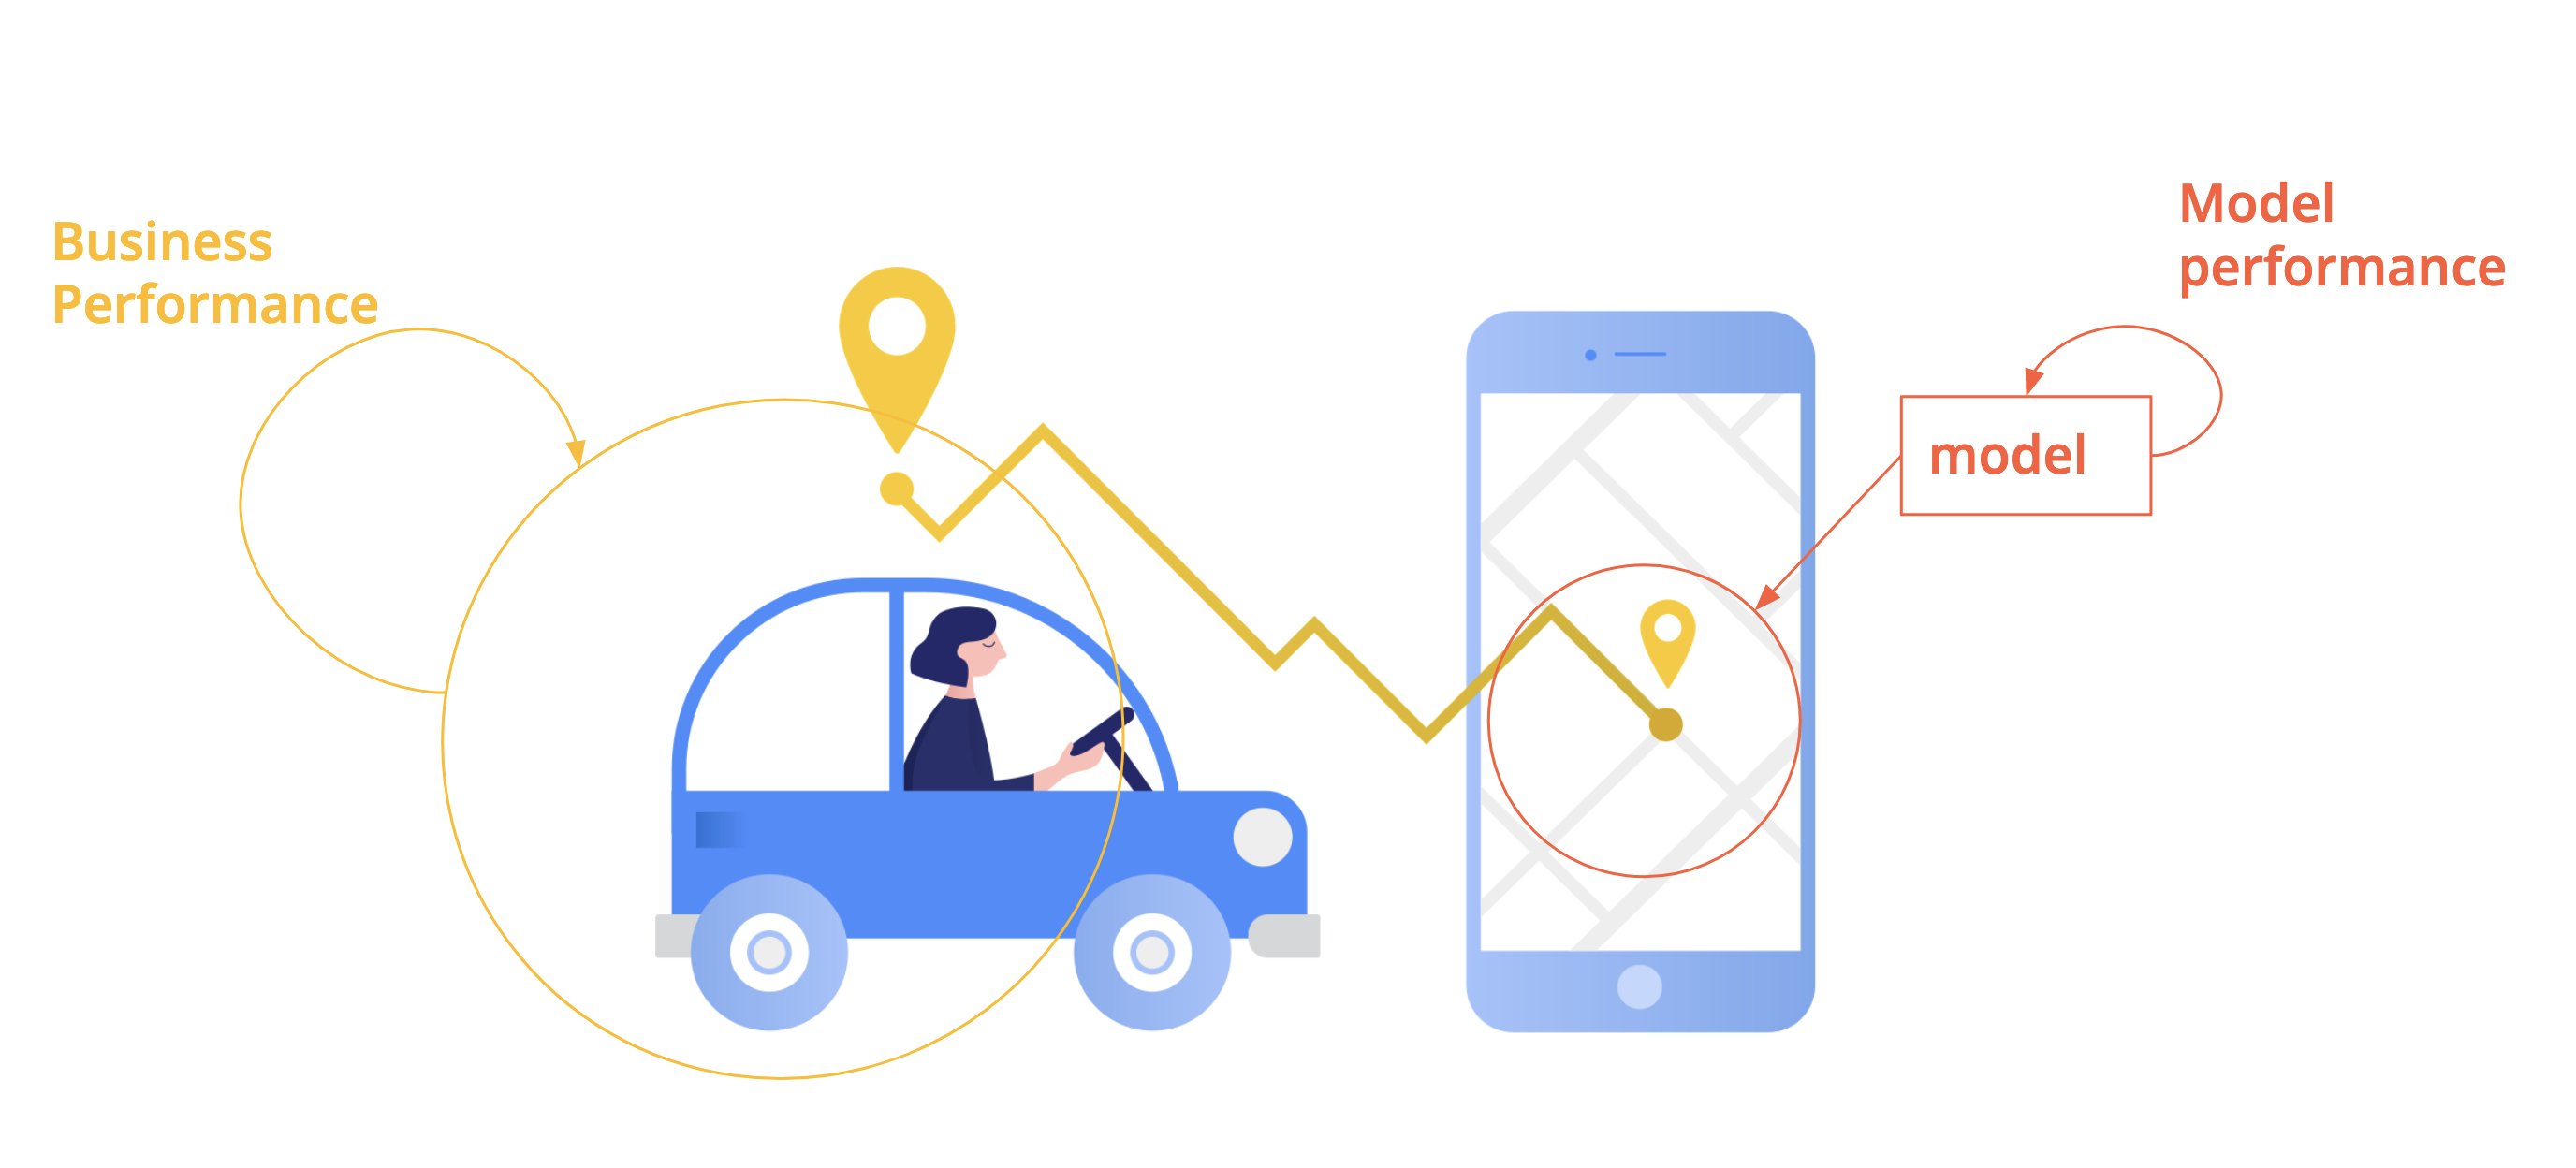
Business performance: measured usually by one KPI (key performance indicator)
Model performance: an offline metric that captures how well the model will fit the business need
Business performance vs. model performance#

Business performance vs. model performance#

Business performance vs. model performance#

Business performance vs. model performance#
Examples of measuring business performance#
Business metrics:
Click through rate (CTR) - for recommenders
Usage - model that generates html from hand drawn diagrams
Adoption by finance team - internal revenue forecasting
Examples of measuring model performance#
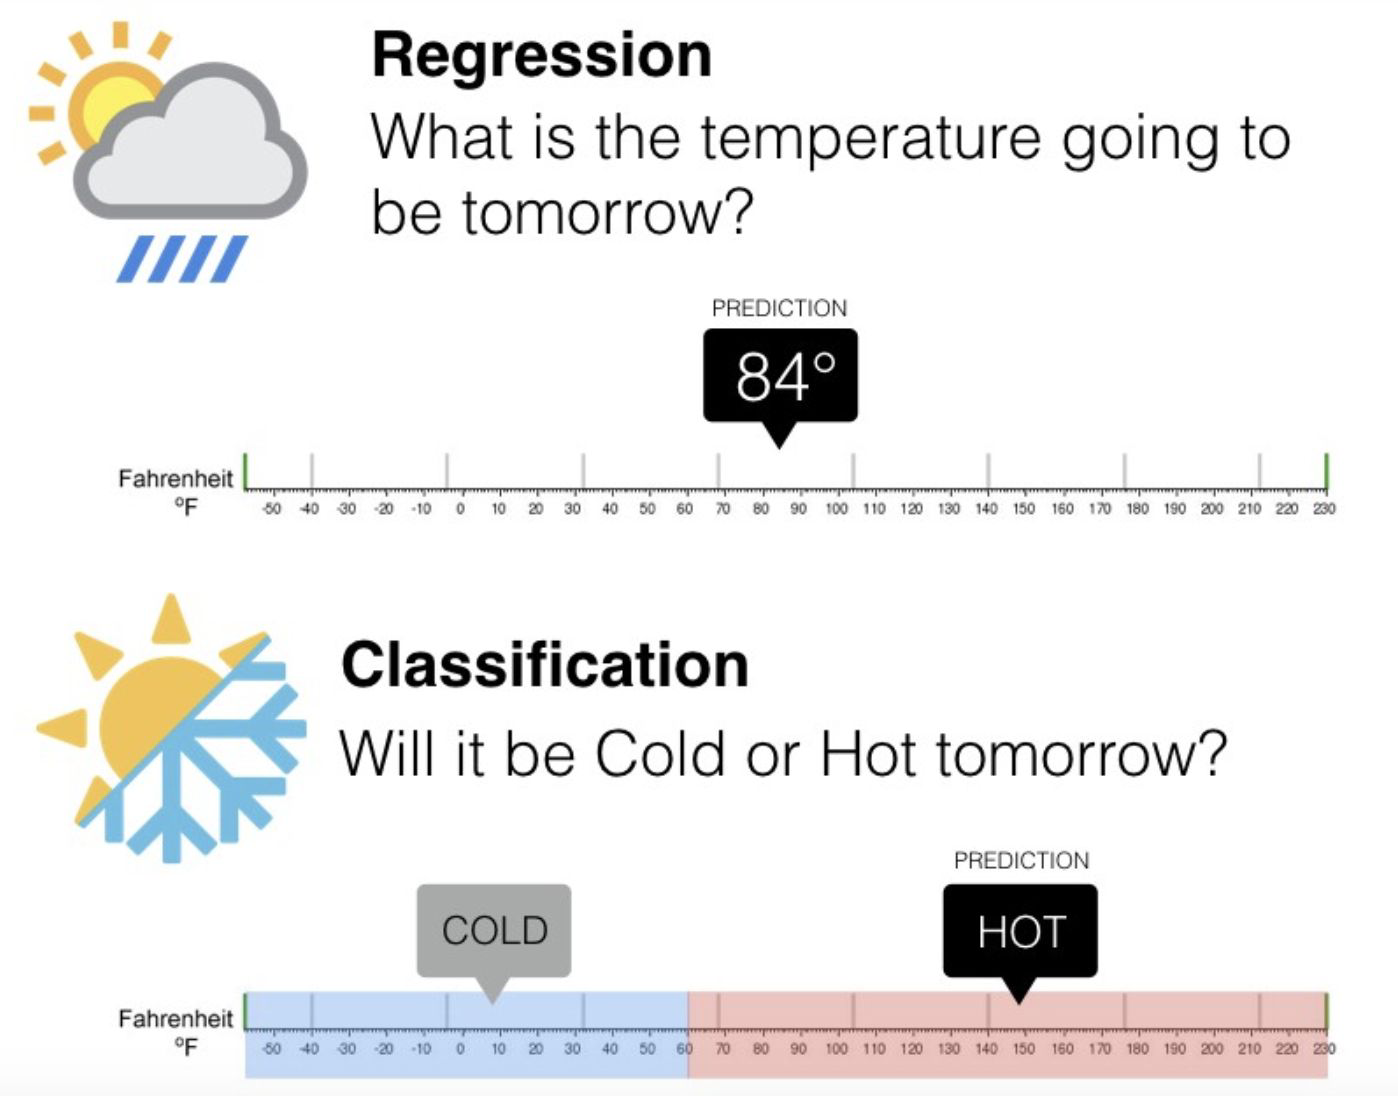
Regression:
RMSE, RMSLE
MAPE ( mean absolute percentage error) - accuracy as a ratio
Classification:
Accuracy
Precision
Recall
Custom metric: based on the worst case scenarios of your product.
Relationship between business performance & model performance#
Thinking of the business value of your model and the cost of being wrong can help you choose the right model metric.
Always start from the value!
Error Analysis#
Remember the Summary vs details?#
Going beyond aggregated metrics#
Most model performance metrics we’ve seen are aggregated metrics
They help determine whether a model has learned well from a dataset or needs improvement
Next step: examine results and errors to understand why and how is the model failing or succeeding
Why: validation and iteration
Types of supervised learning#
Validate your model - inspect how it is performing#
There are lot of ways to do this. You want to contrast data (target and/or features) and predictions.
Regression: looking at residuals, for example doing EDA on residuals and inspecting the outliers
Classification: one can start with a confusion matrix, breaking results in true class and predictions
Confusion Matrix for classification#
Counts how often the model predicted correctly and how often it got confused.
False Positive: false alarm / type I error
False Negative: missed detection / type II error
| Predicted | |||
|---|---|---|---|
| Negatives | Positives | ||
| Actual | Negatives | TN | FP |
| Positives | FN | TP | |
What do the misclassified examples have in common?
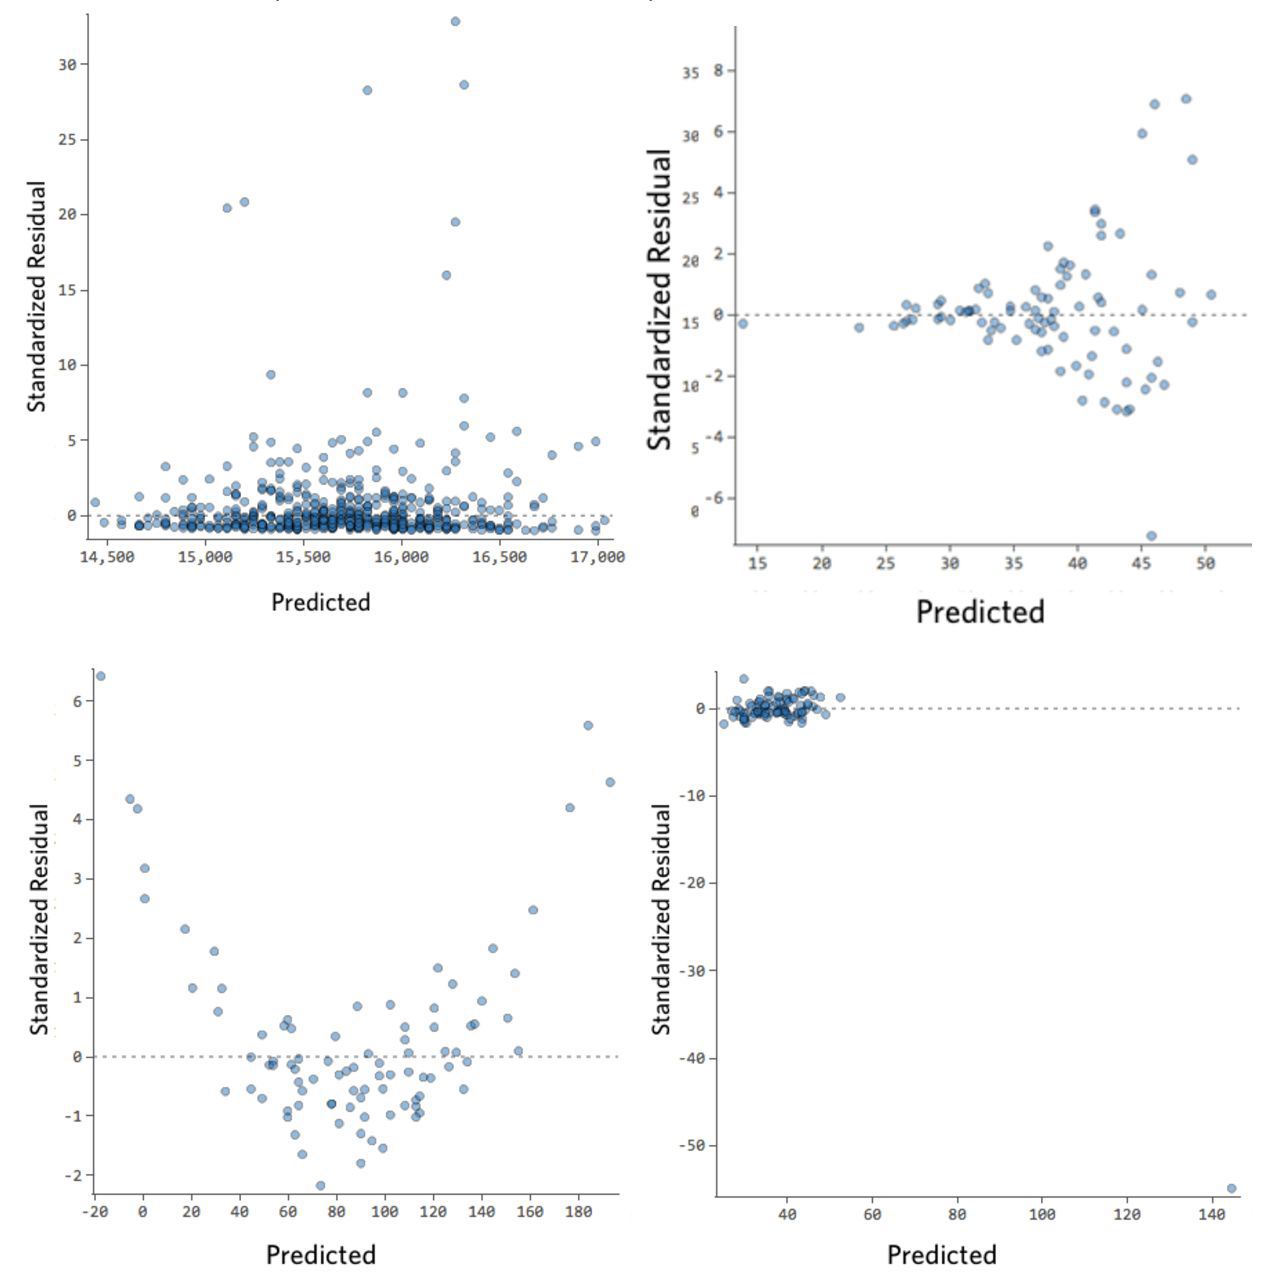
Residual analysis for regression#
This is like EDA again but on residuals (predicted - observed)
Plot residuals /and standardized residuals vs predicted
We want our residuals to have no patterns, to be symmetrically distributed, centered in the middle of the plot
IF NOT…
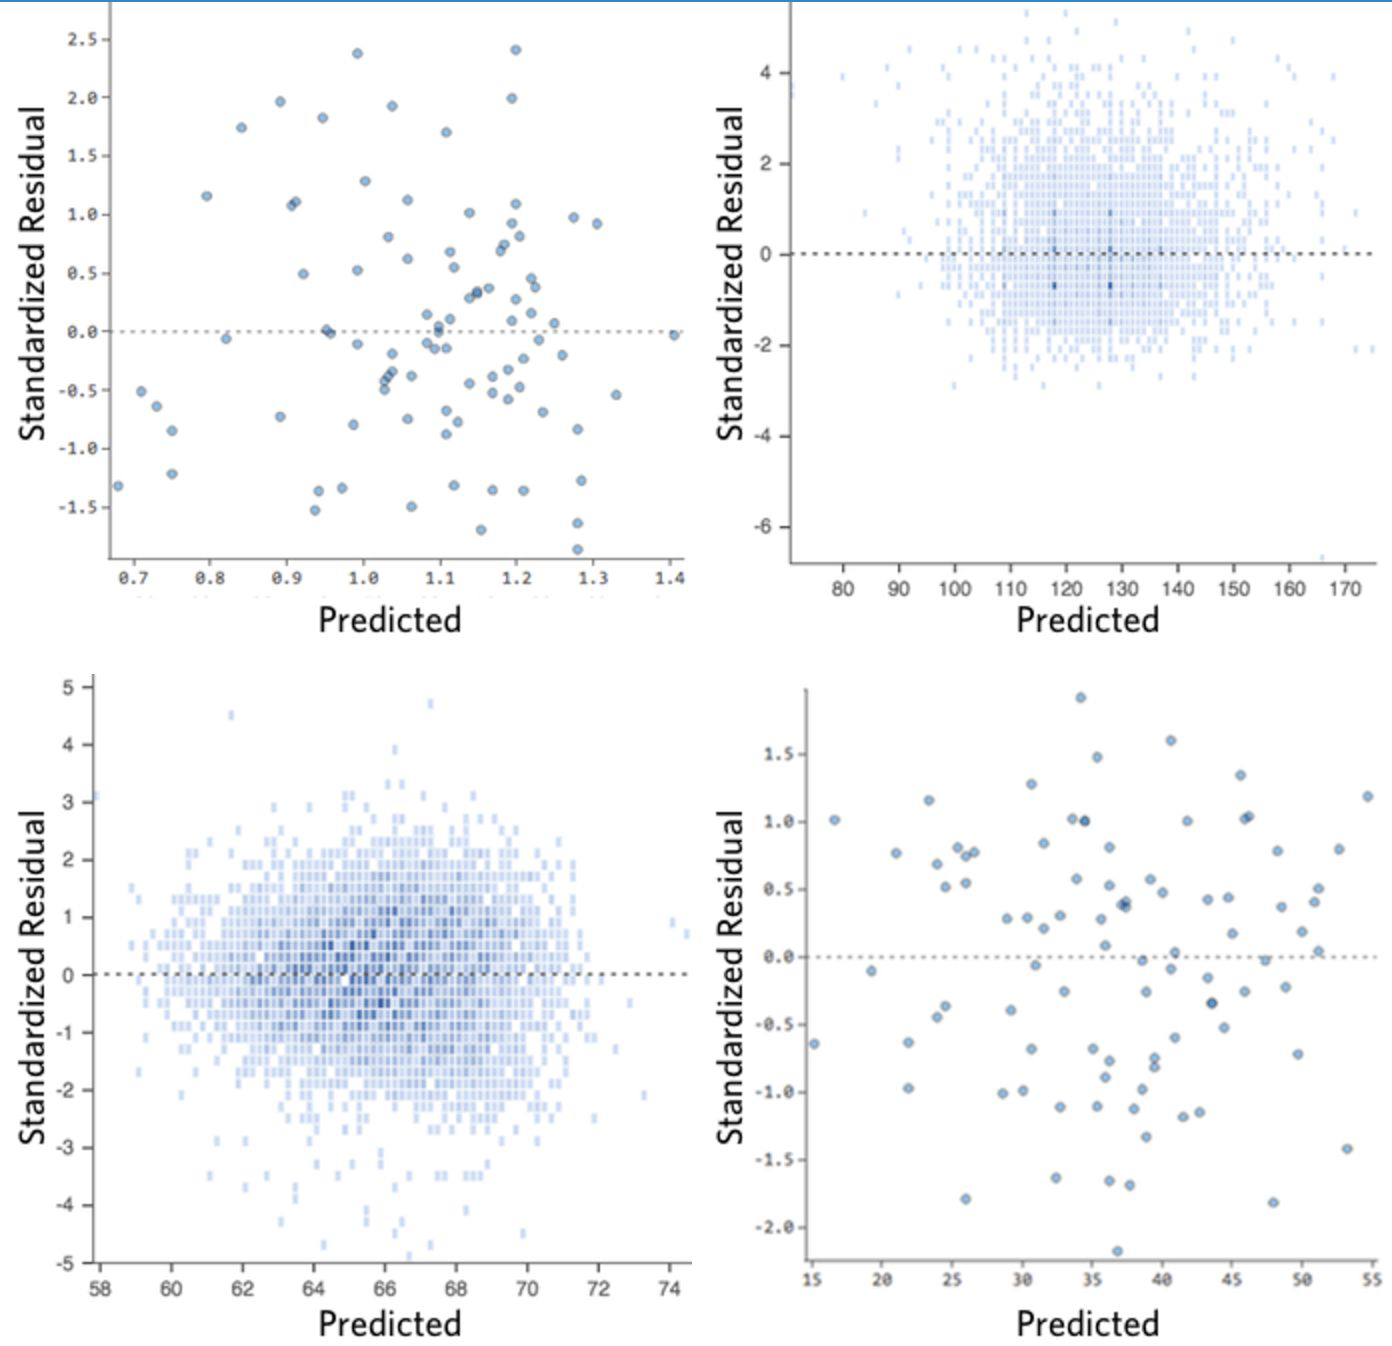
Residual analysis for regression#
IF NOT.. then there is room for improvement in the model.
What if my residuals look like this? Check out this walkthrough
Resources#
https://svpg.com/what-is-a-product/
https://medium.com/analytics-vidhya/root-mean-square-log-error
Building Machine Learning Powered Applications(https://medium.com/analytics-vidhya/root-mean-square-log-error-rmse-vs-rmlse-935c6cc1802a) - EmmanuelAmeisen
https://www.qualtrics.com/support/stats-iq/analyses/regression-guides/interpreting-residual-plots-improve-regression/
https://www.scikit-yb.org/en/latest/api/regressor/residuals.html
Example of EDA with error analysis
https://www.kaggle.com/elitcohen/forest-cover-type-eda-modeling-error-analysis#Error-Analysis
https://www.kaggle.com/pestipeti/error-analysis
https://www.kaggle.com/pmarcelino/comprehensive-data-exploration-with-python
ML Project Topics#
Kickstarter Project Success#
Analyse and model success factors of kickstarter campaigns. Give new projects an idea what is needed for a successful funding and potentially even predict campaign success upfront.
221811 rows of data on campaigns
(medium)

Tanzania Tourism Prediction#
Can you use tourism survey data and ML to predict how much money a tourist will spend when visiting Tanzania?
Survey Data from 6476 participants
(easy/medium)
Fraud Detection Challenge in Electricity and Gas Consumption#
Based on client’s billing history detect clients involved in fraudulent activities
(medium/advanced)
Urban Air Pollution Challenge#
Predict air quality levels and empower communities to plan and protect their health
weather data and daily observations collected from Sentinel 5P satellite tracking various pollutants in the atmosphere
(medium/advanced -> domain knowledge helpful)
Flight Delay Prediction Challenge#
Predict airline delays for Tunisian aviation company, Tunisair
Data on flight delays. Can be combined with airport locations
(medium)
Financial Inclusion in East Africa#
Can you predict who in East Africa is most likely to have a bank account?
Survey data on financial inclusion of ~33,600 participants
(easy/medium)