EDA & Presenting your Results#
The EDA Process - Recap#
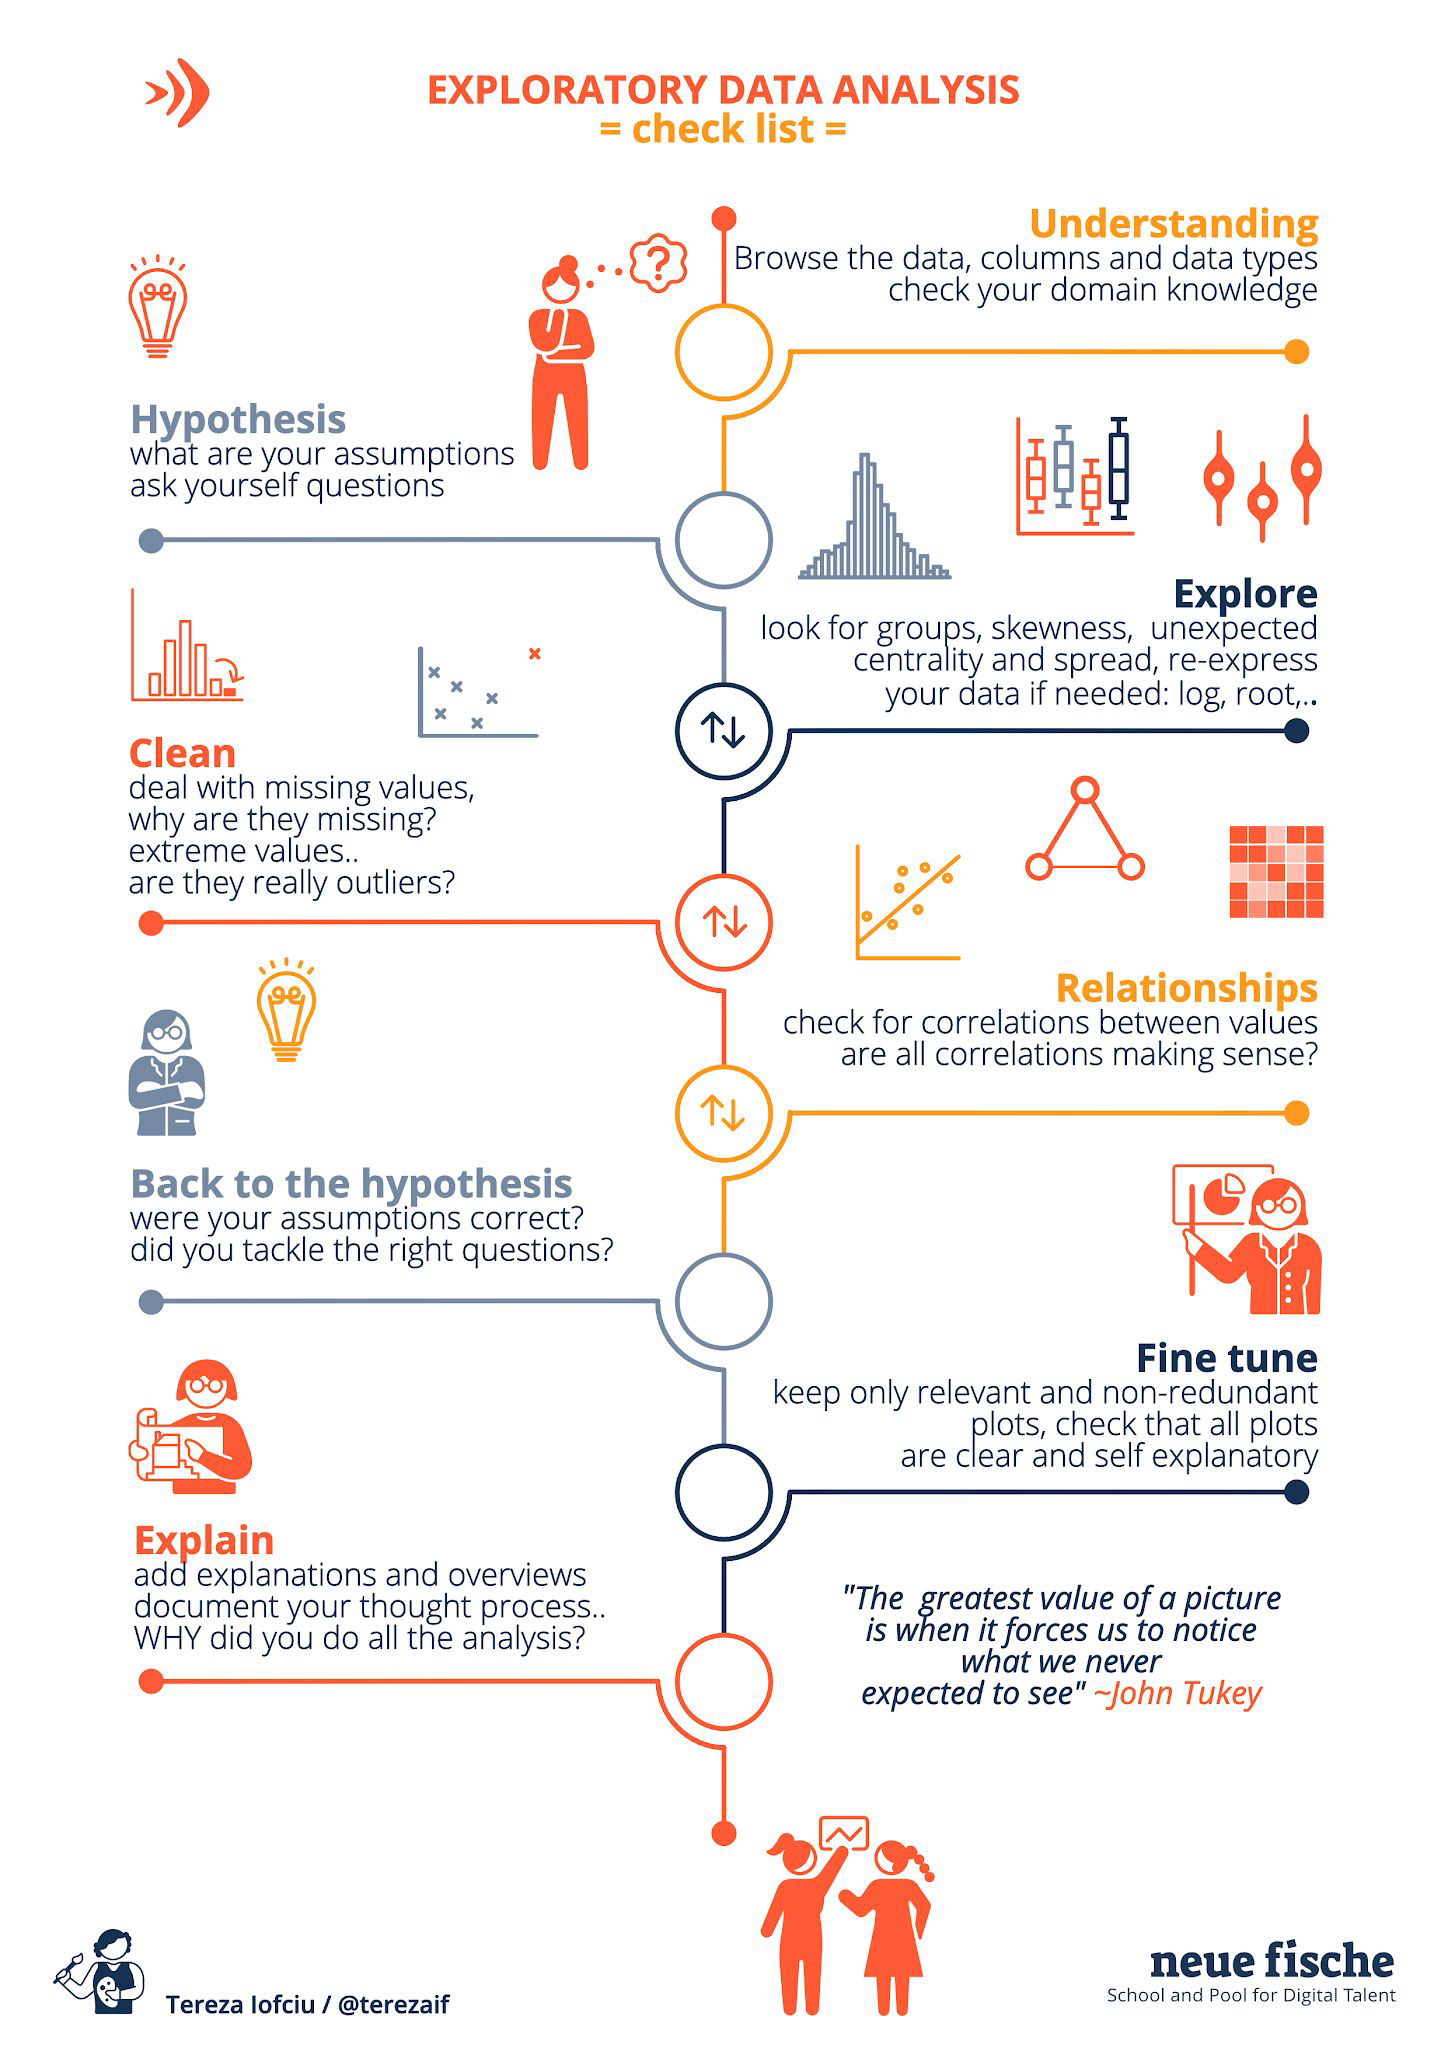
EDA#
Jupyter notebook
overview and goals at the beginning
description of data
general stats about the data
hypothesis about the data
data cleaning
analysis
findings
EDA Proof of Concept - Workflow#
Timeboxed work! so use an iterative process
make a draft of plan
do simple plots
answer main questions (from hypothesis generation)
iterate: go deeper, go prettier, go better
clean up and document
Start early with the slides!
Dos and Don’ts of EDA#
EDA Should Enable#
Exploration
Analysis
Discovery
Communication
Dos#
Be truthful, based on real data - you might be lying without knowing
Be accurate and avoid ambiguity
Easy interpretation for your audience - don’t make them work at trying to decipher a chart or computation
Elegant and aesthetically pleasing for better understanding - it’s not about doing pretty charts, but about better understanding
Common mistakes#
Not cleaning the data
Cherry picking - focusing on a metric that proves your assumptions
Focusing on (or ignoring) outliers - outliers should be considered as a factor and not as an indicator
Chart junk - sometimes less is more
Missing or ignoring data patterns - seasonality, holiday, weekends …
Lacking action - recommendations, conclusion, hypothesis
How not to lie… don’t truncate#
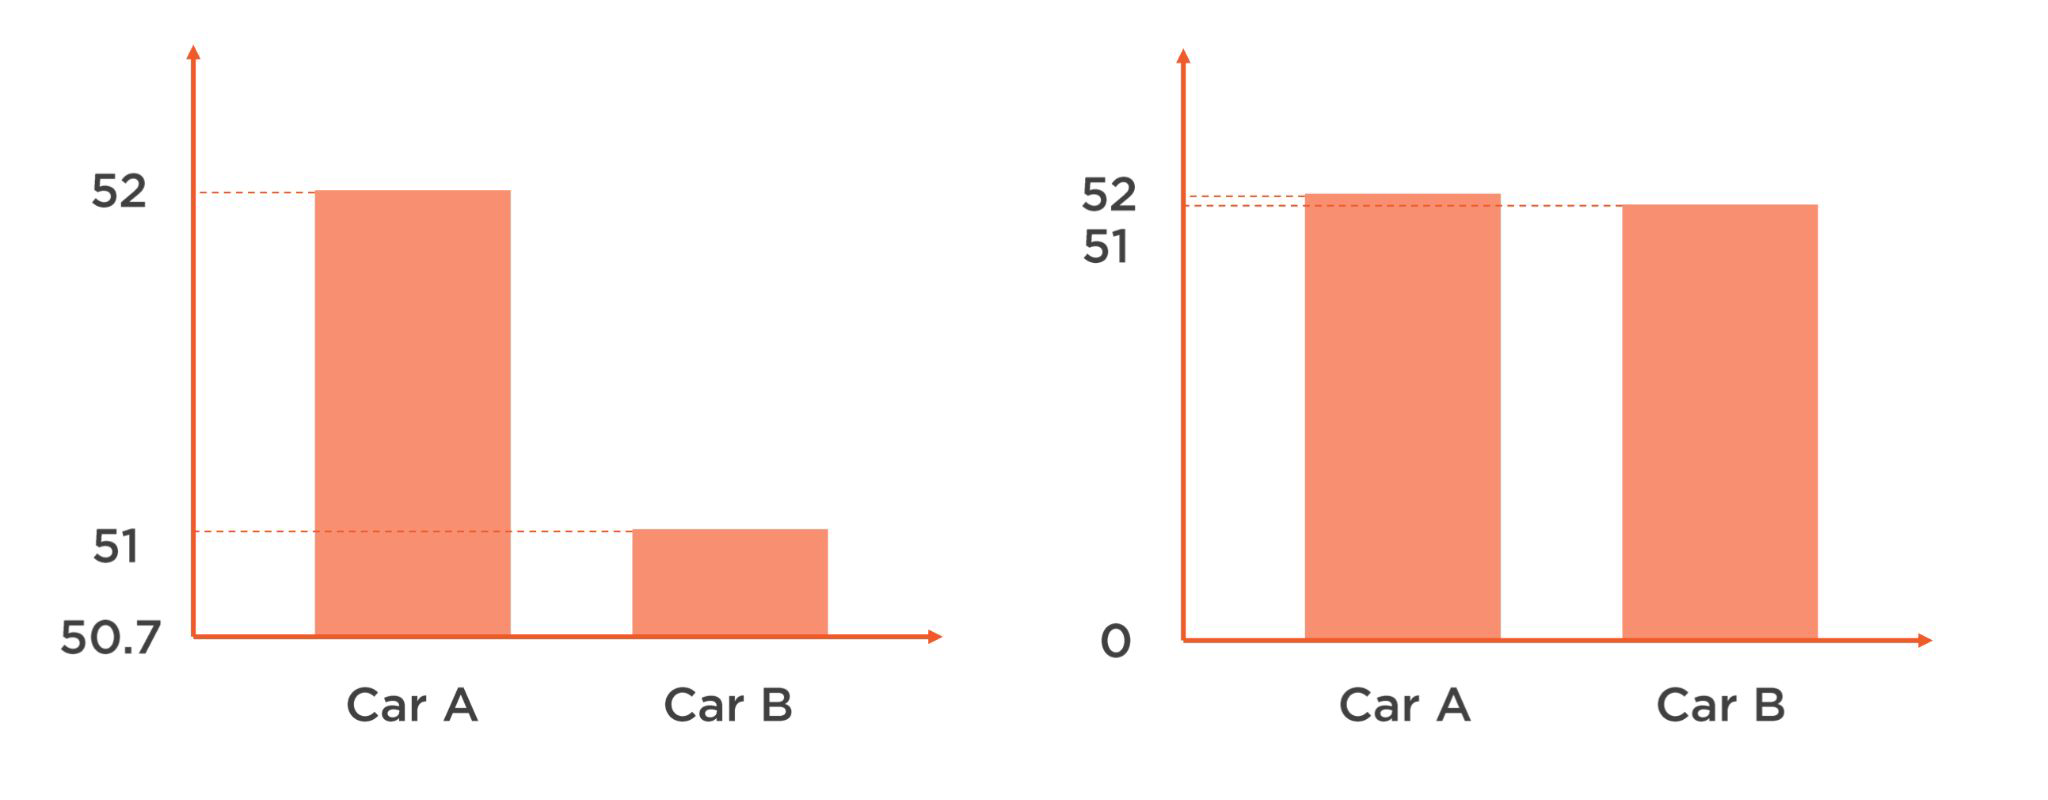
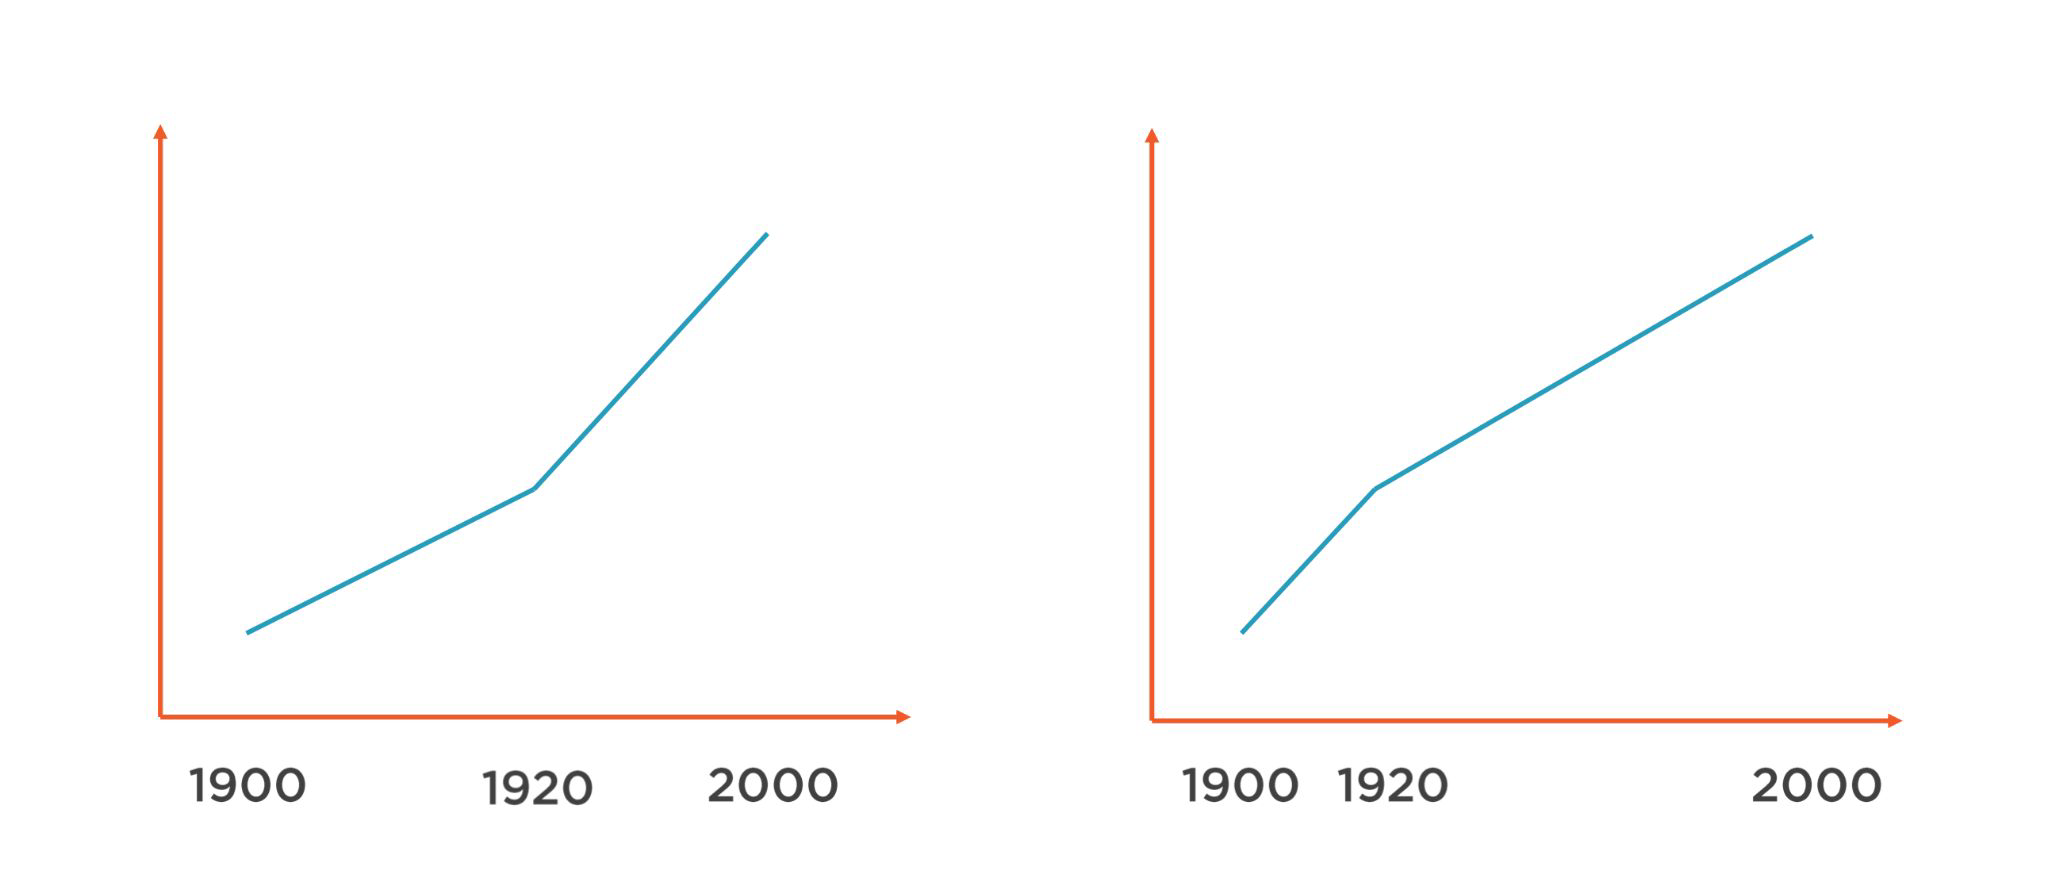
How not to lie… use an appropriate scale#
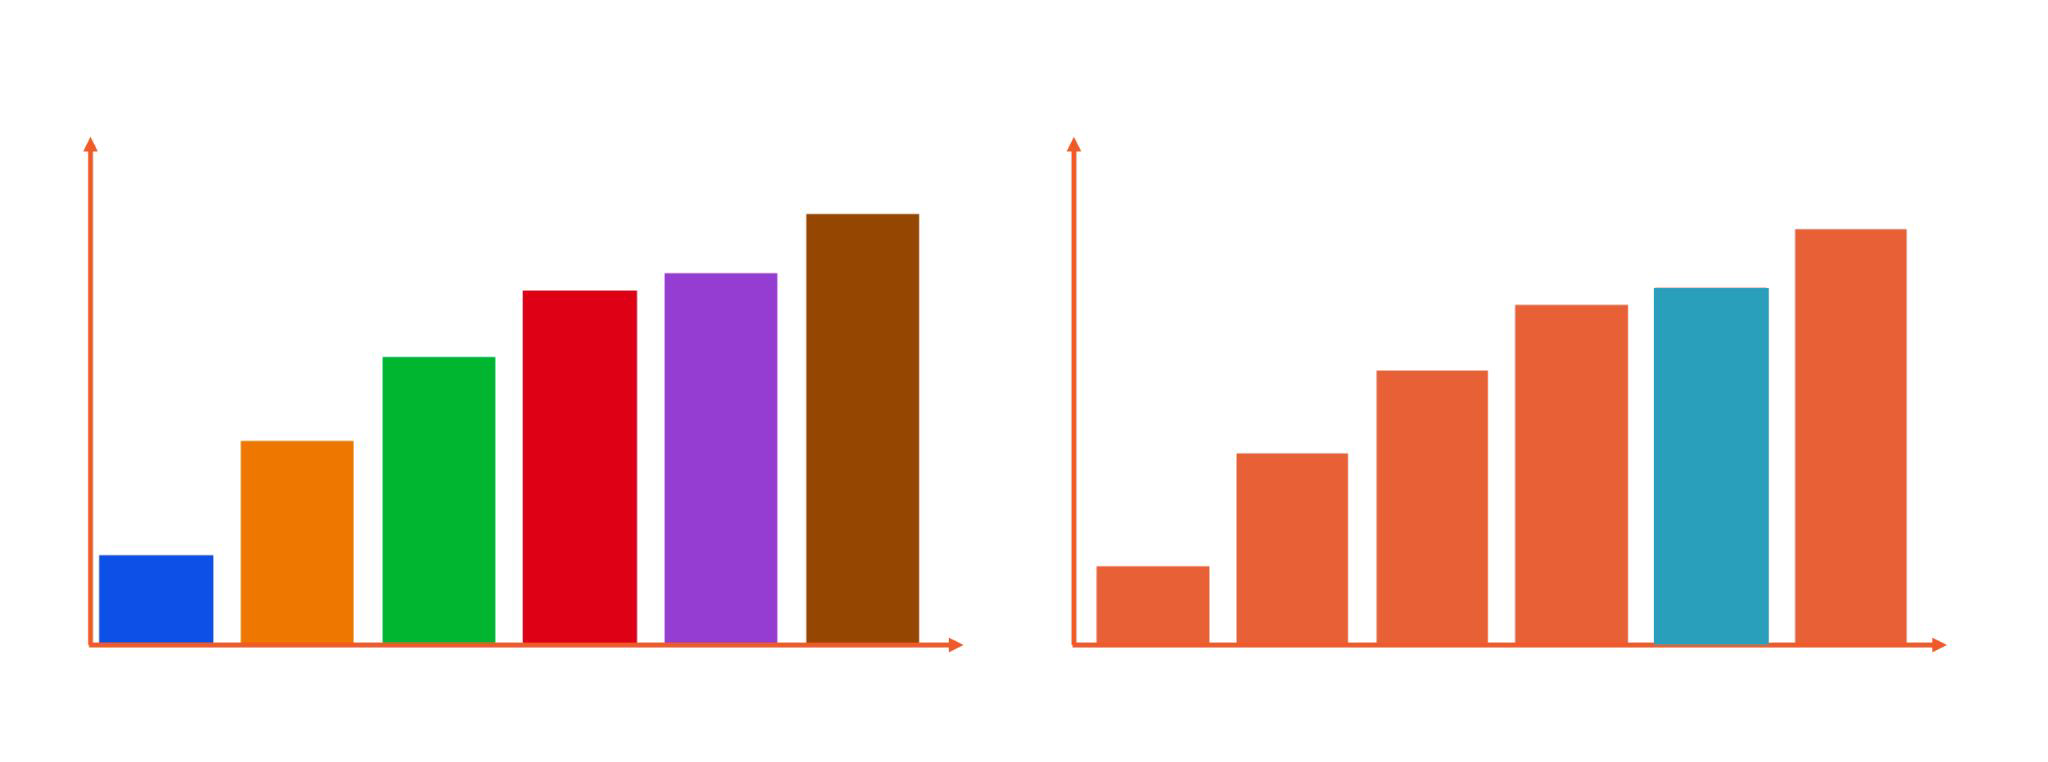
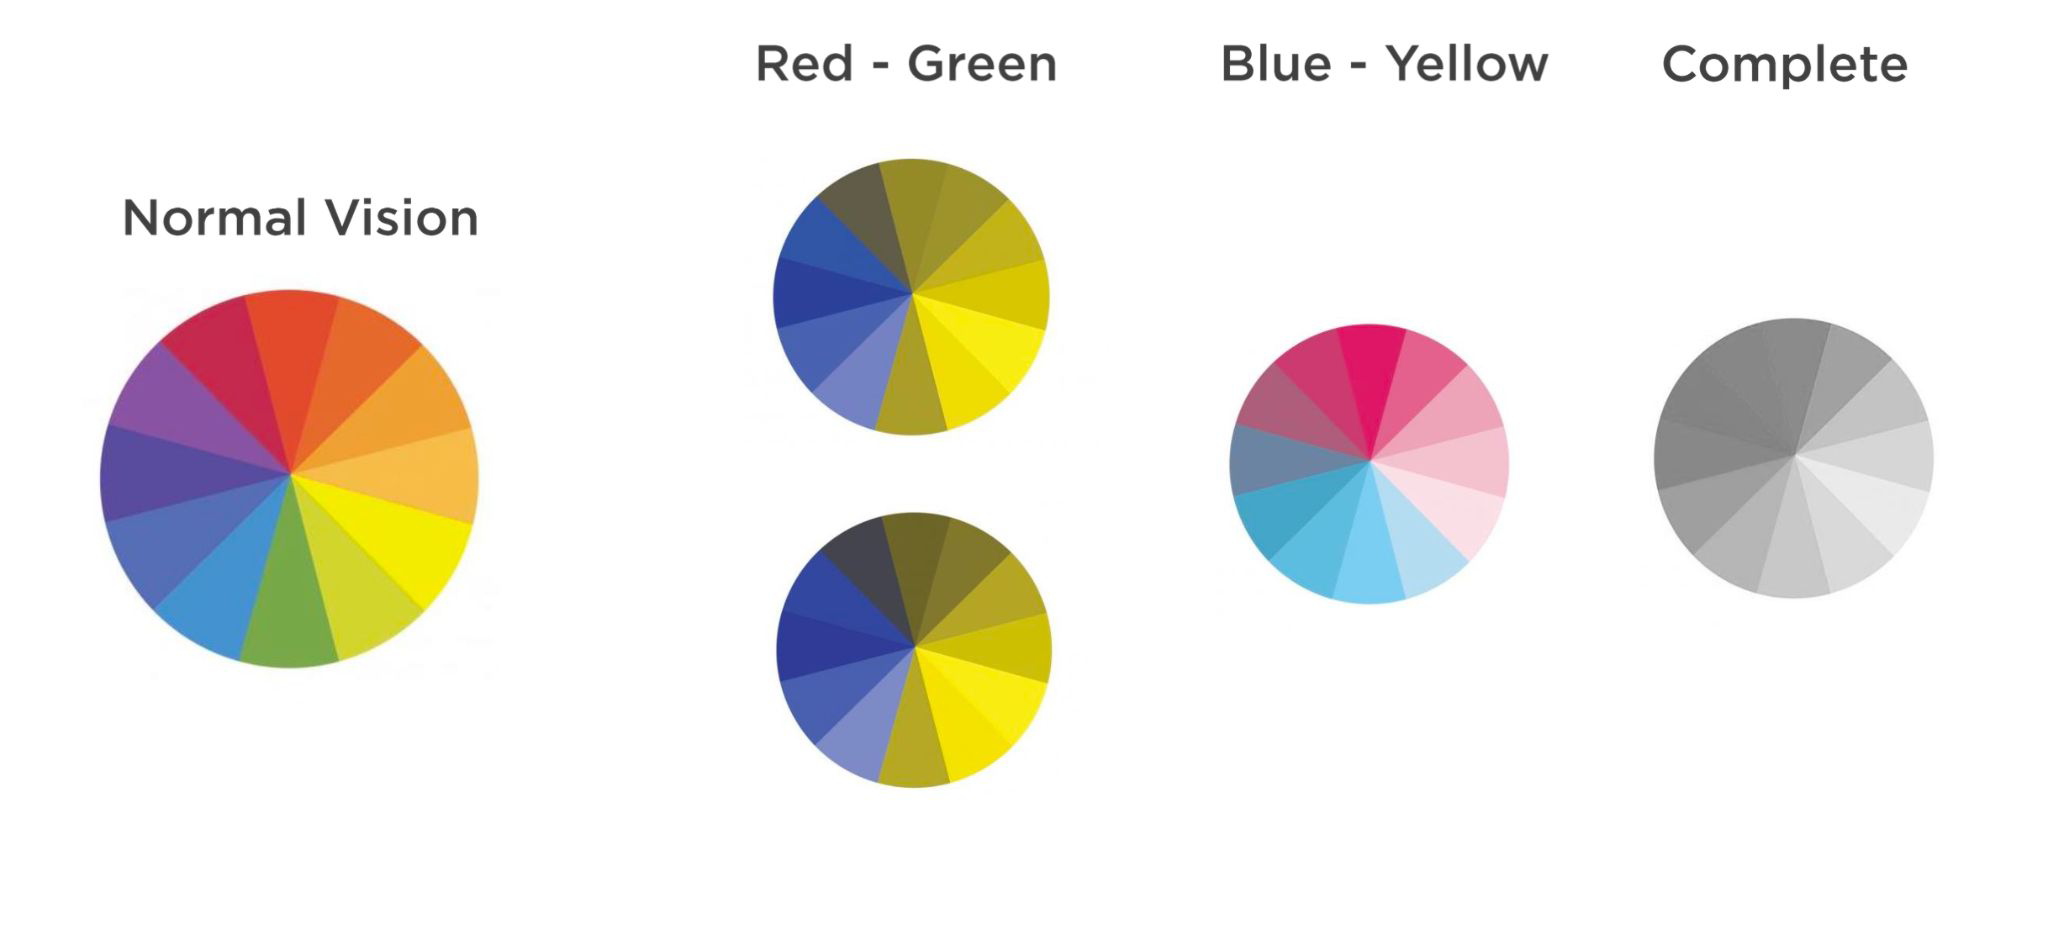
If you use colors be intentional#
Color blindness - avoid mixing green and red at least#
Presenting your results#
Presentation of EDA#
Use Slides!
setting the scene
intro to the dataset
intro about client
intro about the quality of the data
focus on hypothesis: whys
methodology: hows
describing the findings and changes in approach… in context
generated knowledge: insights
future work
if possible: show impact and applications how to make your ds presentation great
Think of your audience - usually a mix#
Technical people - how it is made, why did you decide this or that
Business people - how is it good for business, how much impact, enable decision-making
Sales people - how is it useful or attractive for customers
Don’t lose your audience…#
Keep it simple and stupid (KISS principle)
Be concise and accurate, no extra information if not needed
Join explanation blocks with “whys” and “hows”
Be clear, don’t be ambiguous - clarity inspires trust in your results